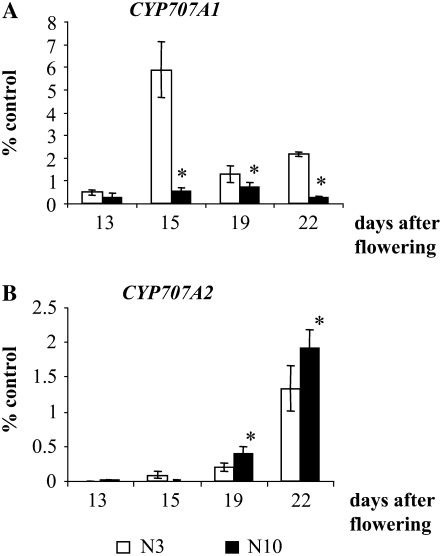
Figure 6.
CYP707A1 and CYP707A2 gene expression levels in developing siliques from N3 and N10 plants. A, CYP707A1 expression in developing siliques from N3 and N10 plants. B, CYP707A2 gene expression in developing siliques from N3 and N10 plants. CYP707A1 and CYP707A2 mRNA levels were determined by qRT-PCR and expressed as percentages of the control EF1α gene. Error bars indicate se (n = 3). Siliques (13–22 d after flowering) were harvested from N3 (white bars) and N10 (black bars) plants. Expression levels for both genes were significantly different (*, P < 0.05) in N3 and N10 siliques (at 15–22 d after flowering for CYP707A1 and at 19 and 22 d after flowering for CYP707A2), as determined by ANOVA followed by Fisher's lsd test.

