Figure 6.
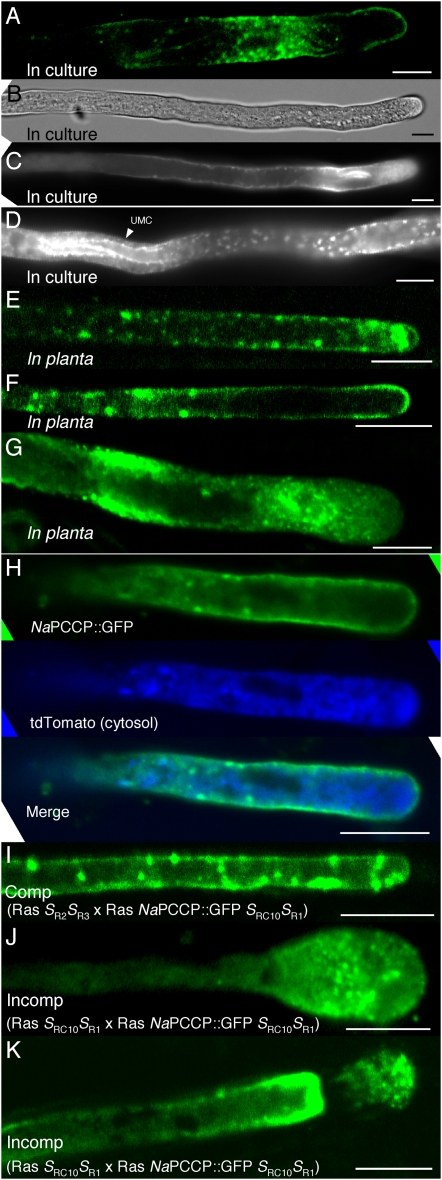
Live imaging of NaPCCP∷GFP localization. A to D, N. tabacum pollen tubes expressing NaPCCP∷GFP in culture. A, Fluorescence image of a single optical section. B and C, Bright-field (B) and fluorescence (C) images of a single tube tip. D, Fluorescence image of a region distal from the tip with a UMC. E to K, Optical sections of NaPCCP∷GFP pollen tubes in planta. E to G, Tip-proximal regions of pollen tubes growing in N. tabacum pistils. H, Pollen tube expressing NaPCCP∷GFP (top; green) and cytosolic tdTomato (center; blue). Bottom, A deconvolved merged image. I to K, NaPCCP∷GFP in compatible and incompatible pollinations. I, Compatible Rastroensis SR2SR3 × Rastroensis SRC10SR1 NaPCCP∷GFP pollination. J and K, Incompatible Rastroensis SRC10SR1 × Rastroensis SRC10SR1 NaPCCP∷GFP pollinations showing distorted pollen tubes. Bars = 10 μm.

