Figure 2.
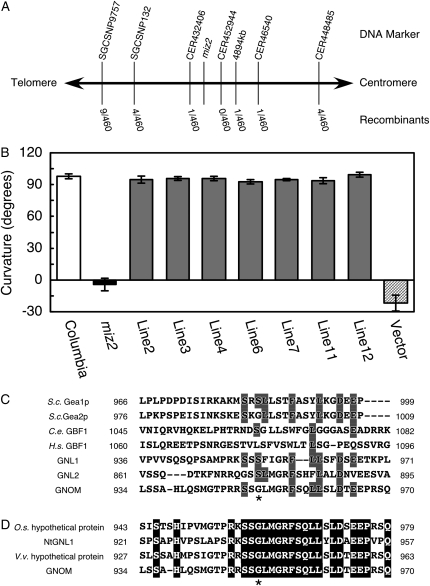
Identification of the miz2 gene. A, Map-based cloning of the miz2 locus. DNA markers and the number of recombinants observed for the corresponding marker, as a fraction of the total number of chromosomes, are shown. B, Complementation test for hydrotropism in miz2 plants. Hydrotropic curvature 12 h after hydrostimulation is presented. White bar, wild type; black bar, miz2; gray bars, independently generated transgenic lines; hatched bar, vector control. Data represents the means ± sd of at least 17 individuals. C, Amino acid sequence alignment of the miz2 mutation and the flanking residues for the following Gea/GNOM/GBF family members: budding yeast Gea1p and Gea2p (S.c. Gea1p and S.c. Gea2p, respectively), Caenorhabditis elegans GBF1 (C.e. GBF1), human GBF1 (H.s. GBF1), and Arabidopsis GNL1 (At5g39500) and GNL2 (At5g19610) gene products. Sequences were aligned with GNOM using ClustalW (Thompson et al., 1994). Identical residues are shaded. D, Amino acid sequence alignment of the miz2 mutation and the neighboring amino acids for plant GNOM homologs. Putative proteins of rice (O.s. hypothetical protein; EAY91294), grape (V.v. hypothetical protein; AM461845), and tobacco GNOM-like1 (NtGNL1; EF520731) proteins were aligned with GNOM using ClustalW (Thompson et al., 1994). Identical residues are highlighted. In both C and D, asterisks indicate the mutated residue in miz2.

