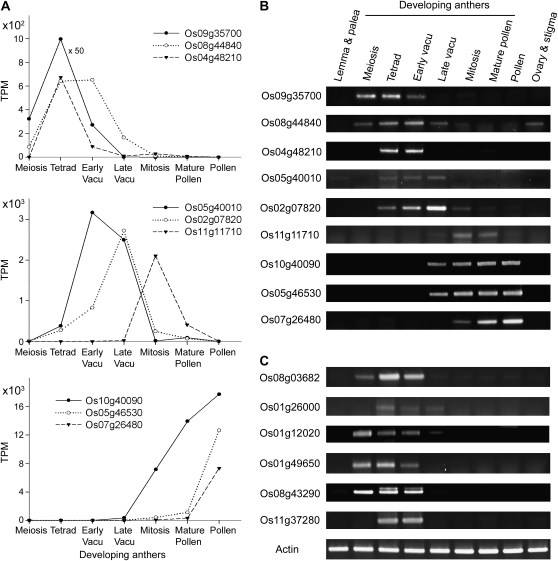
Figure 2.
Variations in the developmental profiles of anther transcripts. A, TPM of sample transcripts. B, RT-PCR results of the transcripts shown in A. C, RT-PCR results of special transcripts related to exine formation (Table V). Actin transcript was used as a loading control. The x axis of the developmental stages in this and other figures is not a linear time scale. Vacu, Vacuolated.

