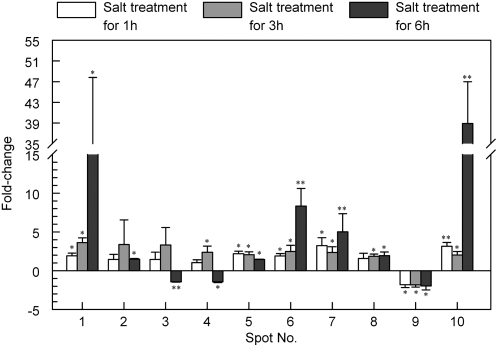
Figure 3.
Histogram showing fold changes in abundance (following 200 mm NaCl treatment for 1, 3, and 6 h) for each of the protein spots in three independent experiments. Values plotted are mean values with sd. The significance of the differences between treated and untreated groups is indicated by asterisks: * P < 0.05, ** P < 0.01.

