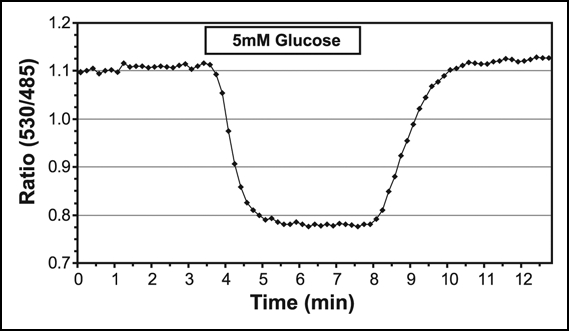
Figure 1.

Quantitative analysis of glucose flux from an Arabidopsis root expressing FLIPglu-600µΔ13, a FRET sensor for glucose with an affinity of 600 µM. The root of a 10 day-old seedling was placed into a perfusion chamber and perfused with hydroponic medium with or without 5 mM glucose. eCFP was excited and emission was recorded for eCFP and eYFP every 10 seconds (essentially as decsribed in ref. 17). The emission intensities for a region-of-interest were averaged and the emission ratio was determined at the two wavelengths for each image of a time series and plotted on the Y-axis against time on the X-axis. Addition of glucose is indicated.
