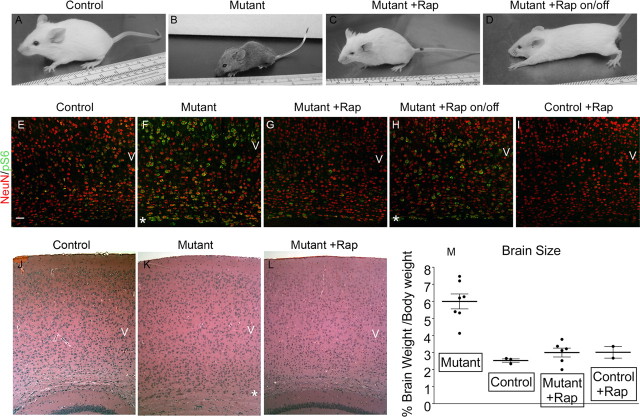
Figure 2.
Clinical and histological improvement in Tsc1null-neuron mice treated with rapamycin. A–D, Pictures of mice. Control and mutant (Tsc1null-neuron) mice with or without rapamycin treatment are shown. Rapamycin was given 6 mg/kg intraperitoneally every other day from P7 to P9 and was discontinued at P30 in the on/off mouse. A, C, D are all P45; B is P30. Note abnormal posture of mutant and mutant on/off treatment mice. E–I, Combined NeuN (red)–pS6(S235/236) (green) stains of base of cortex over the anterior hippocampus. P45 control, P30 mutant (Tsc1null-neuron), P45 rapamycin-treated mutant, P45 rapamycin-treated mutant until P30 then taken off drug (on/off), and P45 rapamycin-treated control mouse sections are shown. Scale bar, 50 μm. Images were collected using the confocal microscope on a single slice at 200× with 0.7 zoom. J–L, Hematoxylin and eosin stains of the cortex demonstrate mild cortical disorganization in the mutant mouse with global cell enlargement particularly at the base of cortex (*), with improvement with treatment. Ages and treatments are as in E–G. Genotypes for mice were as follows: A, E, I, J, Tsc1c+ SynICre+; F, L, Tsc1c− SynICre+; B, C, D, G, H, K, Tsc1cc SynICre+. M, Brain weight to body weight ratio in these same groups of mice, all at P30. Each point is a different mouse; the line indicates the mean. p < 0.01 for each group compared with untreated mutant. Numbers and genotypes of mice were as follows: Mutant, six Tsc1c− SynICre+; Control, three Tsc1c+ SynICre+; Mutant + Rap, three Tsc1cc SynICre+, three Tsc1c− SynICre+; Control + Rap, two Tsc1c+ SynICre+.

