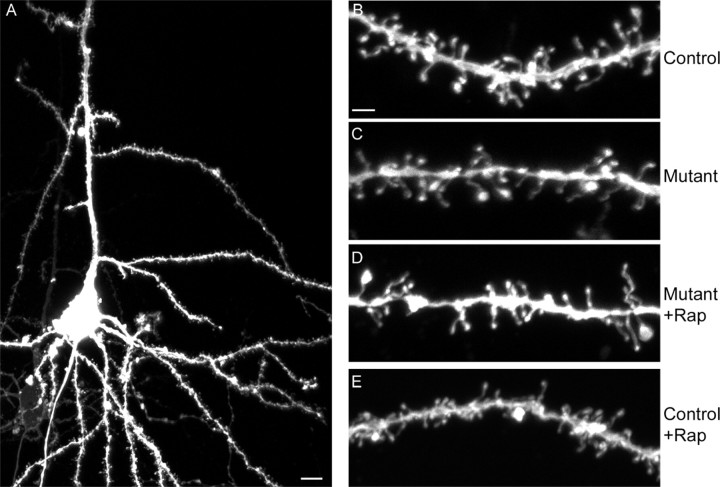
Figure 6.
Dendritic spines in Tsc1null-neuron brains and response to rapamycin. A–E, Confocal images of DiI-stained P23–P30 brain sections are shown. All are Z-stacked. A, C, and D were Tsc1cc SynICre+; B and E were Tsc1c+ SynICre+. A, Representative pyramidal neuron with apical dendrite. Scale bar, 10 μm. 200× confocal image with 1.5 zoom. B–E, Dendrite segments from control, mutant (Tsc1null-neuron), rapamycin-treated mutant, and rapamycin-treated control mice. Scale bar, 2 μm. 630× confocal images with 1.5 zoom.

