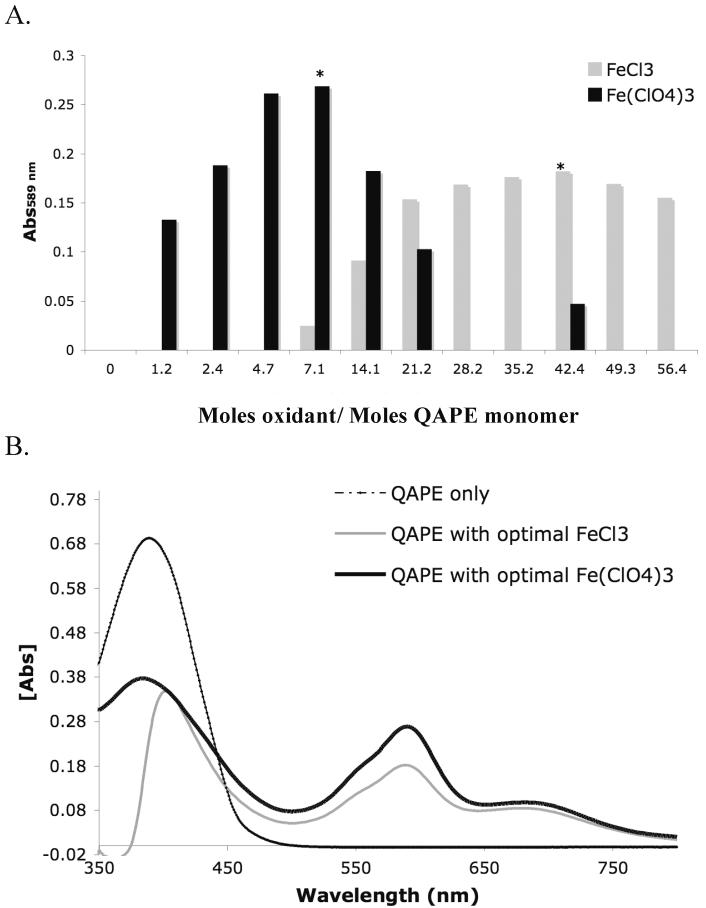
Figure 4.
A) The effect of the ratio of molar equivalents of FeCl3 (grey) or Fe(ClO4)3 (black) to (monomer) molar equivalents of QAPE is inferred from the presence of absobance signals at 589 nm. Optimal molar ratios are indicated by an asterisk (*). B) UV-vis spectra of QAPE undoped (dashed), QAPE with optimal molar equivalents of FeCl3 (grey), and QAPE with optimal molar equivalents of Fe(ClO4)3 (black).

