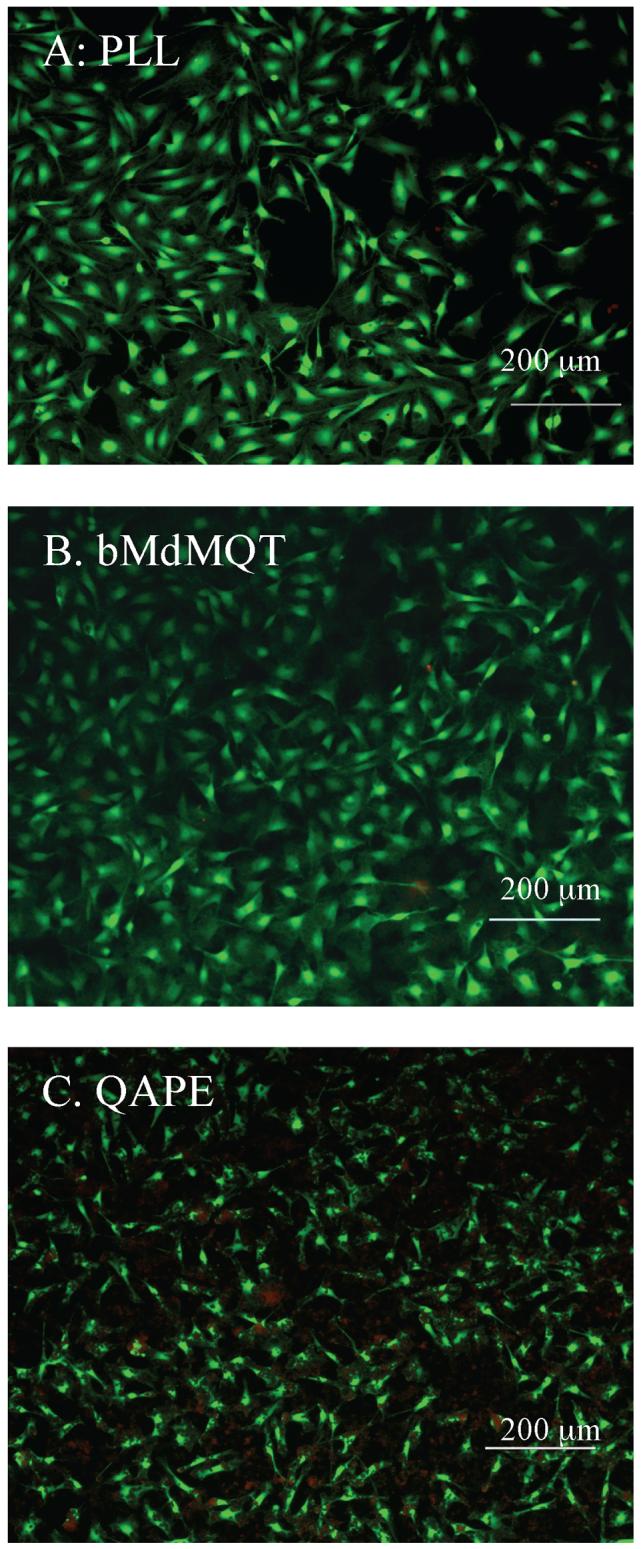
Figure 6.

Live/Dead stain of Schwann cells after 48 h of growth on A) PLL, B) bMdMQT, and C) QAPE-coated glass coverslips. Living cells fluoresce green and dead cells fluoresce red. Images were taken individually, with appropriate bandpass filters and subsequently merged. Scale bar 200 μm.
