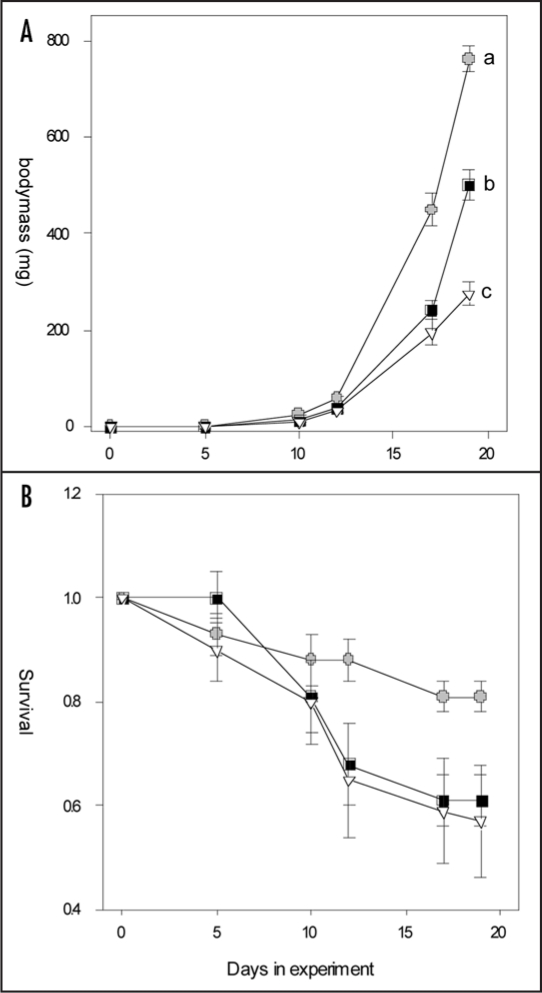
Figure 5.
Growth curves (A) and survival rate (B) of M. brassicae larvae on B. oleracea plants treated with 500 µg jasmonic acid to the shoots (open triangles), to the roots (black squares) or with acid water only (controls, grey circles). Error bars indicate SEM. Different letters indicate significant differences between growth curves after Repeated Measures ANOVA (protected contrasts, p < 0.001) or in survival rates at day 19 (Kruskall-Wallis ANOVA, p = 0.03).

