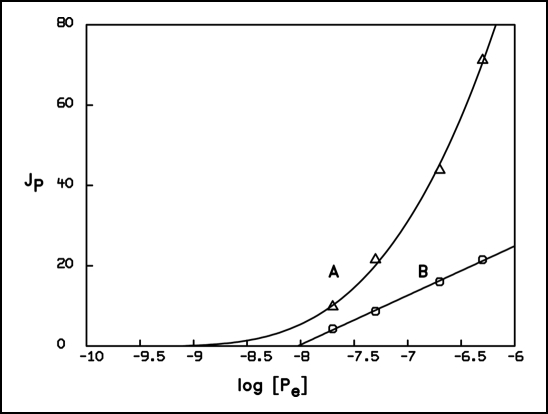
Figure 3.
Thellier plots of initial uptake velocities (curve A) and of steady state uptake rates in adapted states (curve B) vs the logarithm of the respective concentrations; Graph A obtained from the initial velocities of Figure 2 was fitted using the non linear equation: JP= 1.0 · (log[Pe] − log(0.74 · 10−9)) + (3.0 · (log[Pe] − log(0.74 · 10−9))3, whereas graph B obtained from the steady state rates of Figure 2 was fitted using the linear function JP = 12.3 · (log[Pe] − log(9.38 · 10−9)). The phosphate uptake rate JP is given as µmol · (mg chl.·h)−1, the logarithm of the external phosphate concentration is expressed relative to the unit standard concentration.

