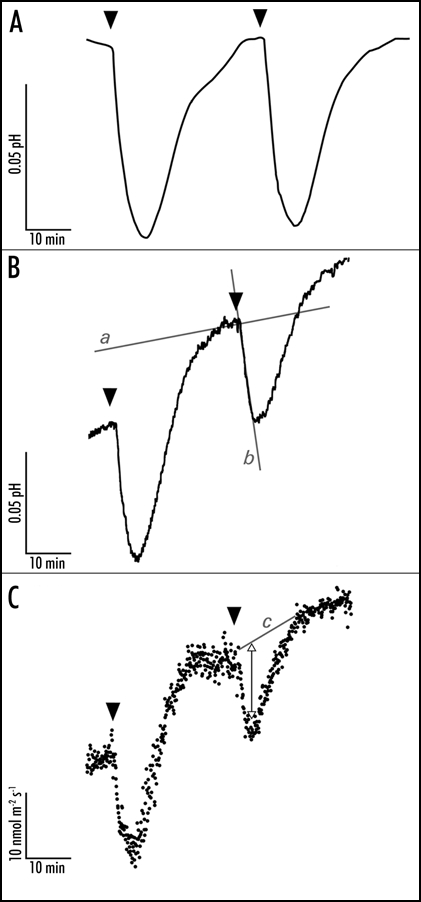
Figure 1.
Representative traces of the blue light-induced apoplastic responses at the mesophyll-facing side of the abaxial epidermal layer of a young expanding pea leaf. The apoplastic acidification is measured with a conventional flat-tipped pH electrode (A) which is carefully placed against the epidermal layer and a vibrating probe system MIFE that measures apoplastic pH (B) and proton fluxes (C) in the unstirred layer of the epidermis. After a 30s 100 µmol m−2 s−1 blue light pulse (indicated by the arrowheads) the pH lowers and the proton efflux increases within two minutes. After half an hour the pH and proton fluxes are back at basal level and a new blue light pulse is given. In all the traces it is evident that blue light affects the apoplastic pH with comparable response kinetics. The initial apoplastic acidification rate is used as the measure to investigate effects on the apoplastic pH. Hence, changes in proton fluxes (C) lead to changes in apoplastic acidification (A and B). The apoplastic acidification rate is calculated by subtracting the basal acidification rate (line a) from the blue light-induced acidification rate (line b). The change in efflux is determined by eye: basal level is drawn (line c, C) and the maximal change in flux is measured (double arrow). The trace in (A) is corrected for first order function, which describes the basic apoplastic acidification rate.

