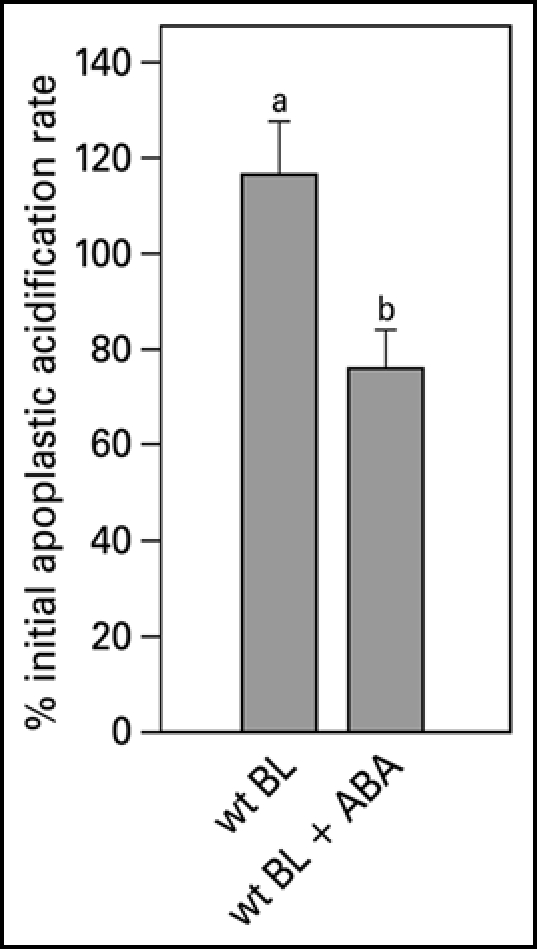
Figure 5.

Blue light-induced relative apoplastic acidification rate of the abaxial epidermal layer of young expanding wt pea leaves measured with a conventional flat-tip pH-electrode in the presence or absence of 20 µM ABA. The apoplastic acidification rate is expressed as the percentage of the average of the acidification rate as induced by three blue light pulses given at the start of the experiment in control solution. Values are the means ± SE of at least five independent experiments. The letters above the bars indicate the statistical group of the results from a one-way ANOVA, with Newman-Keuls as post test, α = 0.05. BL = blue light (100 µmol m−2s−1).
