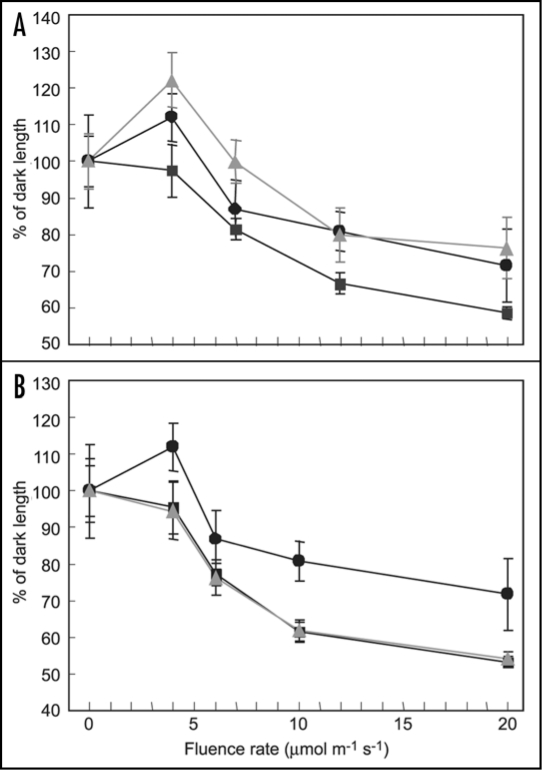
Figure 1.
Fluence response curve for hypocotyl length of wild-type and transgenic BVR seedlings. CAB3::pBVR2 and MERI5::pBVR1 lines are compared with No-O WT and 35S::pBVR3 seedlings grown at 20°C on Phytablend medium containing 1% sucrose for 7 d under continuous blue light of various fluence rates. Data points represent mean (+SD) of hypocotyl lengths measured for 10 to 25 seedlings in each of three independent experiments, and correspond to No-O WT (■), 35S::pBVR3 (●) and CAB3::pBVR2/MERI5::pBVR1 (▲, gray).

