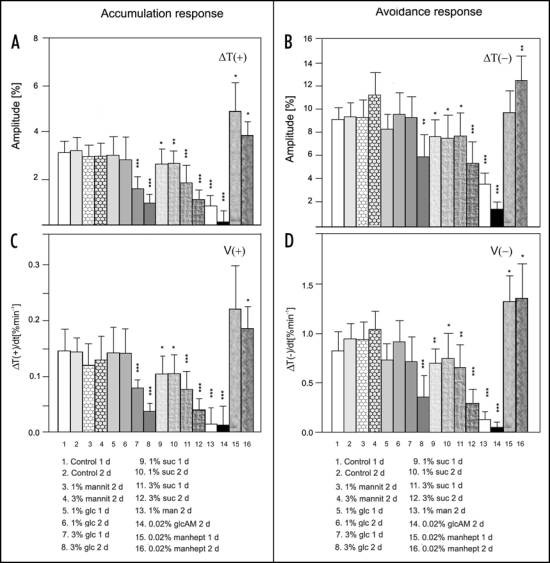
Figure 3.
Influence of exposure time and sugar concentration on chloroplast responses in leaves of wild type Arabidopsis thaliana: amplitudes of (A) accumulation response and (B) avoidance response; velocities of (C) accumulation response and (D) avoidance response. The accumulation response was activated by weak blue light of 1.6 µmol m−2 s−1 and avoidance response by strong blue light of 120 µmol m−2 s−1. Each column represents the average of six to twelve measurements of individual leaves from different plants. Error bars represent SD. Asterisks denote the significance of differences (p value calculated with the unpaired t-test, *p = 0,01-0,05; **p = 0,01- 0,001; ***p < 0,001). Mannit, mannitol; mannohept, mannoheptulose; other abbreviations as in Figure 2.

