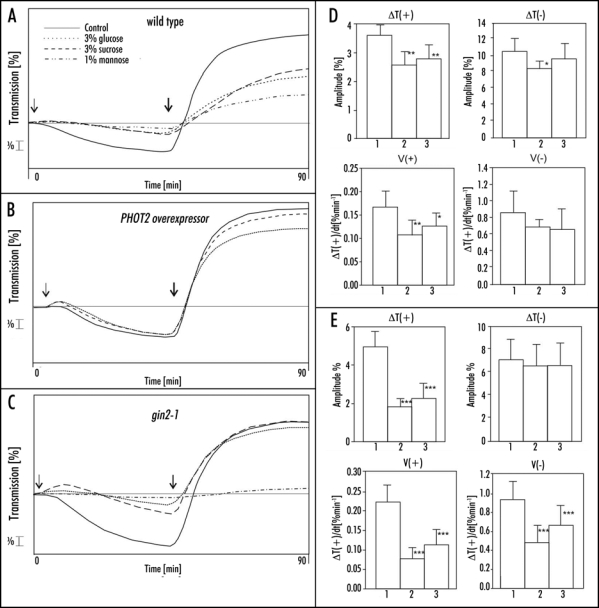
Figure 5.
(A–C) Representative chloroplast responses to continuous blue light in leaves of Arabidopsis thaliana; (A) wild type, (B) PHOT2 overexpressor and (C) gin2-1 after 2 days of incubation with sucrose, glucose and mannose. Arrows indicate start of illumination with weak (↓1,6 µmol m−2 s−1) and strong (↓120 µmol m−2 s−1) blue light. Mean parameters of chloroplast responses in (D) PHOT2 overexpressor and (E) gin2-1. Each column represents the average of six to twelve measurements: 1, control leaves, two days on agar; 2, leaves adapted with 3% glucose for two days; 3, leaves adapted with 3% sucrose for two days. Error bars represent SD. Asterisks denote the significance of differences (p-value calculated with the unpaired t-test, *p = 0.01-0.05; **p = 0.01-0.001; ***p < 0.001).

