Figure 1.
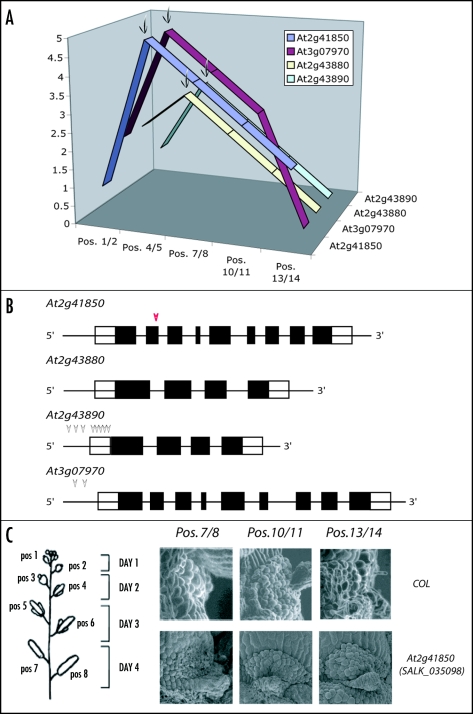
Floral organ abscission specific PGs and their T-DNA insertion lines. (A) Expression of four PGs that showed specific upregulation during floral organ abscission is demonstrated. X-axis represents the developmental stages of floral organ abscission. Pos. 1/2 and Pos. 4/5 represent pre-abscission, Pos. 7/8 represents during abscission, and Pos. 10/11 and Pos. 13/14 represent post-abscission. Y-axis represents the relative level of expression of these four PGs and the names of each gene are shown in the z-axis. Four arrows indicate the positions that are associated with cell separation and upregulation of the PGs during abscission. (B) Gene structures of abscission specific PGs and the positions of the T-DNA insertions in each mutant. Each arrow indicates the position of the T-DNA insertion for the mutant. At2g41850 (SALK_035098, red arrow head) is further examined for petal abscission zones using SEM as shown in (C). (C) Schematic diagram of flower positions in wild type in Arabidopsis and SEM of petal abscission zones from SALK_035098 and wild type. Flower position 1 denotes the flower position where white petals protrude right after anthesis and subsequent positions correspond to older stages of flowers. The days after anthesis are demonstrated with flower positions in the right. Note that at flower position 7/8 floral organs are abscised. When comparing during-and post-abscission (Pos. 7/8, Pos. 10/11 and Pos. 13/14) between the mutant and wild type, difference of a delay in floral organ abscission is not observed.

