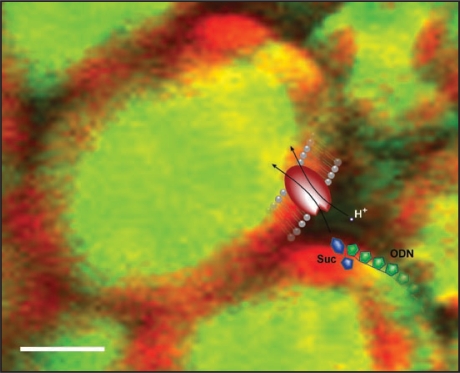
Figure 2.
ODNs “piggyback” on transported sugar molecules. A pictorial representation of ODNs utilizing the sucrose translocator (SUT) to enter plant cells. The confocal microscope projection image shows uptake of fluorescently labeled ODNs (green) in barley leaves after 24 h incubation in 200 mM sucrose.10 Autofluorescence from chloroplasts is shown in red. The superimposed cartoon shows the coupled symport of H+ (white dot), sucrose (blue) and ODN (green) through the SUT (red). Scale bar, 10 µm.

