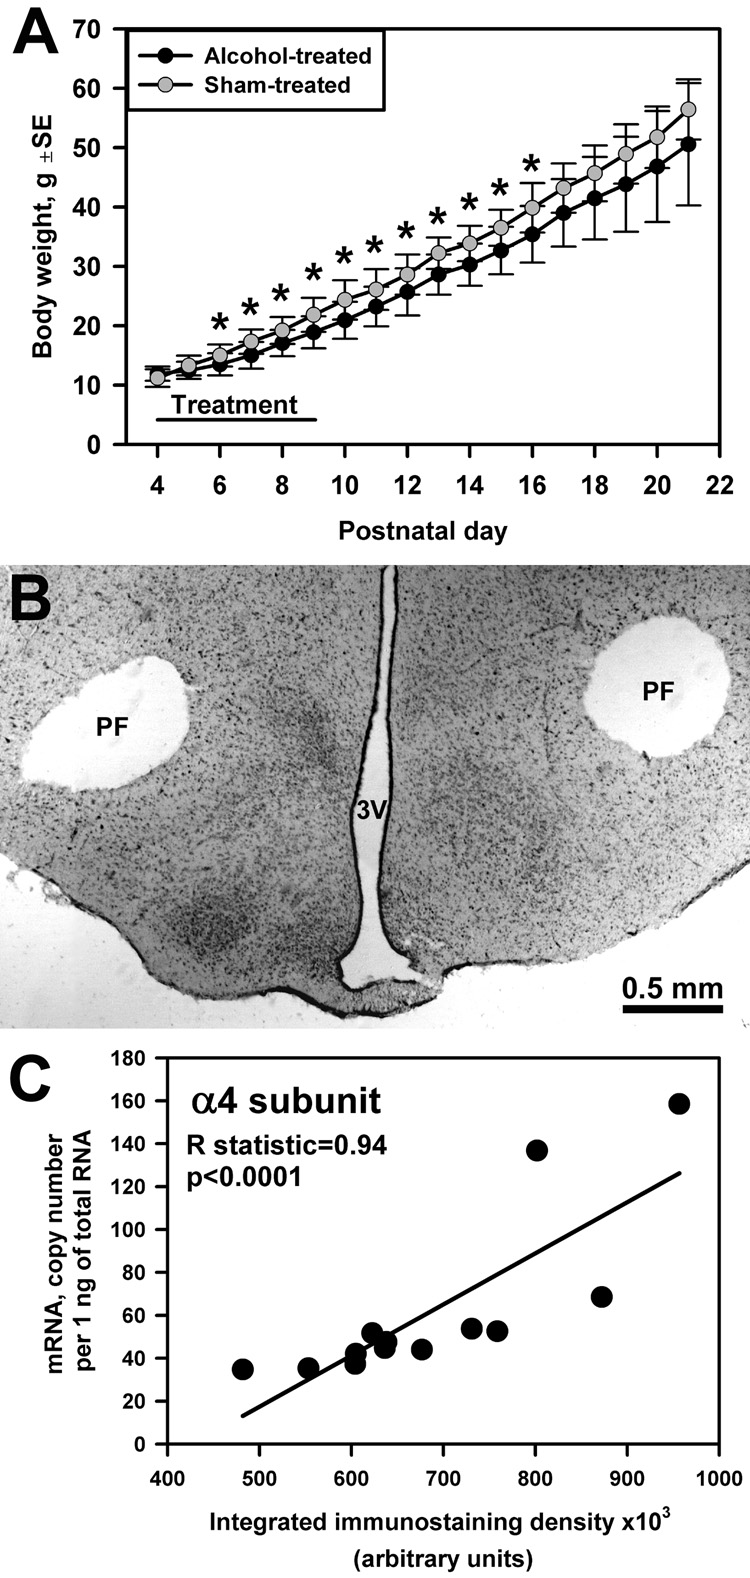
Fig. 1.
(A) Group mean body weight in alcohol- and sham-treated rats (n=11–23 per group) from the beginning of treatment on PD4 to weaning (*, p<0.05 between groups). (B) Neutral red-stained section from a posterior hypothalamic slice showing the location of 700 µm tissue micropunches taken bilaterally from the PF region (PF) (3V, third ventricle). (C) Positive correlation between integrated density of α4 subunit dot-blot immunostaining in hypothalamic tissue samples extracted from one side of the slices containing the PF or VLPO region and α4 subunit mRNA levels in samples taken from the opposite side of each slice (data from 13 pairs of samples from 7 sham-treated rats).

