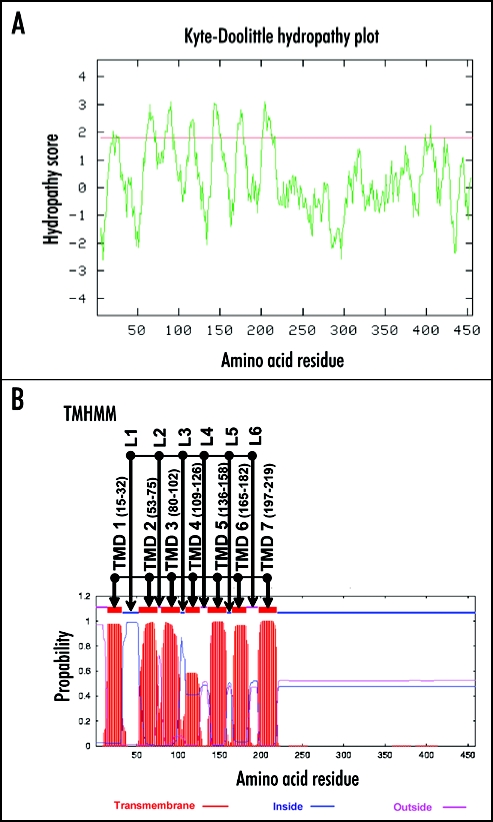
Figure 1.
Transmembrane domain prediction models applied to ALMT1. (A) shows the hydrophobicity of ALMT1 predicted by the Kyte-Doolittle algorithm. Peaks with hydropathy scores greater than 1.8 (red line) indicate likely transmembrane regions. (B) shows the prediction of transmembrane domains of ALMT1 by the TMHMM algorithm. Seven transmembrane domains (TMD 1 to TMD 7, with the amino acid positions of the ends of the domains) with the relative probability on the Y axis and six loop regions (L1 to L6) are shown.

