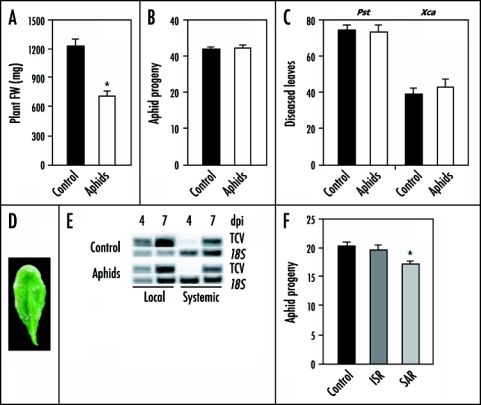
Figure 1.
Arabidopsis-Myzus persicae interactions. (A) Infestation of five-week-old Arabidopsis Col-0 plants with 20 adult aphids for three days significantly reduced the fresh weight (FW) of Arabidopsis rosettes (n = 20). (B) Progeny per adult aphid while feeding for seven days on un-induced Col-0 plants and on plants that had been pre-infested with aphids for three days (n = 15). (C) Percentage of leaves with disease symptoms caused by the bacterial pathogens P. syringae pv. tomato DC3000 (Pst) or X. campestris pv. armoraciae (Xca) in control and aphid-induced Col-0 plants (n = 15). (D) Aphid-vectored TCV symptoms on Arabidopsis Di-0 plants. (E) Local and systemic accumulation of TCV RNA at four and seven days post inoculation (dpi) in inoculated control and aphid-induced Col-0 plants. (F) The number of offspring produced per adult aphid while feeding for six days on uninduced Col-0 plants and on plants expressing P. fluorescens WCS417r-mediated ISR, or P. syringae pv. tomato DC3000(avrRpt2)-induced SAR (n = 20). Green peach aphids (Myzus persicae) were reared on radish (Raphanus sativus), in a greenhouse (25°C, RH 50–70%, L16:D8h). The 16 h light period prevented sexual reproduction, keeping the population clonal. A synchronous colony was started by transferring apterous adults to uninfested radish plants. The aphids were enclosed in clip-cages. After 24 h, the adults were removed and the newly born nymphs kept until they moulted. Using a fine paint brush, single, recently moulted (one to three days) adult apterae were transferred to single Col-0 plants. Each plant was confined in a Magenta GA-7 vessel. offspring per aphid was determined after six to seven days in a climate chamber (23°C, RH 70%, L16:D8h). For induction treatments, all aphids were removed after three days, after which the plants were challenged with fresh aphids or pathogens. Induction of ISR and SAR, and pathogen assays were performed as described (refs. 13,25). Student's t-test (A–C) or one-way ANoVA with a Bonferroni post-hoc test (F) (p < 0.05) was performed to test for significant differences. Statistically significant differences compared to the control are indicated with asterisks.

