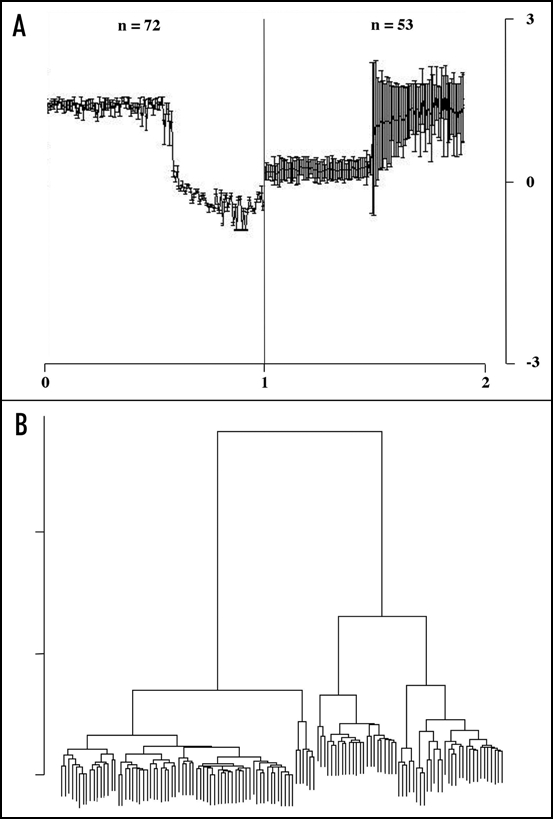
Figure 2.
All-against-all comparison of the Chlamydomonas protein and dendrogram. Relationships between Chlamydomonas proteins and protein-fragments annotated as NCs, inferred using BLAST scores. (A) BLAST score profiles discovered using a self-organizing map. All 125 Chlamydomonas NCs are arrayed along the x-axis on the left hand and again on the right hand panel. The left hand panel shows 72 proteins or protein fragments that all have similar BLAST score profiles (i.e., the BLAST scores of these proteins are correlated with one another). This pattern signifies high BLAST score correlation with the first 72 proteins on the x-axis, and low score correlation compared with the remainder. The remaining proteins conform to the opposite pattern (shown on the right hand panel). (B) Resulting dendrogram of hierarchical clustering applied to the BLAST score data. The cluster on the left corresponds to the 72 proteins that have the pattern shown on the right panel of (A).

