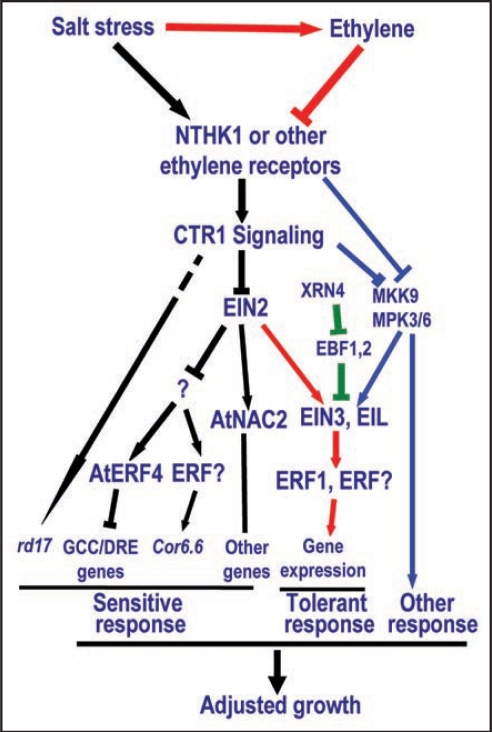
Figure 1.
Ethylene signaling and salt stress response. Black arrows and lines indicate active receptor signaling, which leads to temporary sensitive response under salt stress through suppression of AtNAC2 and activation of AtERF4. Red arrows and lines indicate active ethylene signaling, which inhibits receptor signaling and leads to tolerant response under salt stress. Green lines and bars indicate the pathway regulating the EIN3 stability. Blue arrows and lines indicate new pathway bypassing EIN2 and regulating ethylene response and salt stress response.25

