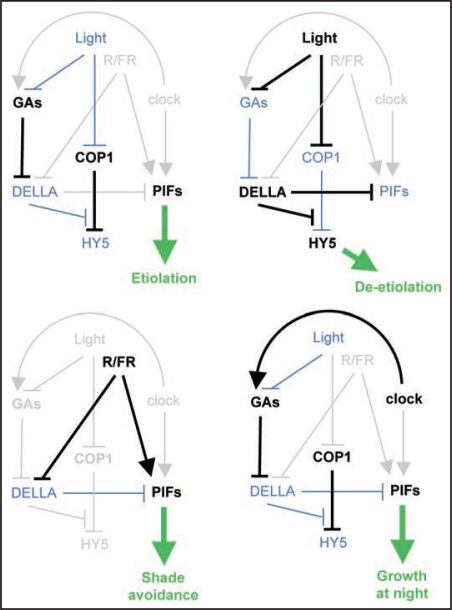
Figure 1.
Molecular interactions between light and gibberellins during plant development. Arrows and bars indicate positive and negative effects respectively. In gray are shown the interactions that are not relevant for each developmental process. Thicker lines are used to depict the occurring activations or inhibitions.

