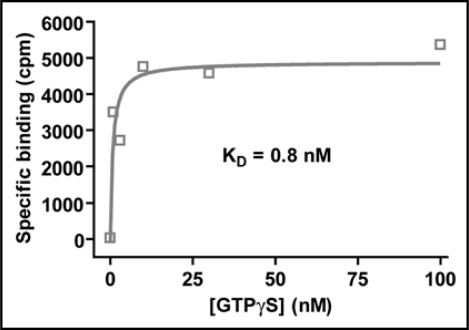
Figure 7.
Saturation binding analysis of the affinity of Mg2+·GTPγS for AtGPA1. 1 nM AtGPA1 was mixed with various concentrations of [35S] GTPγS in the presence of 25 mM MgCl2.6,78 Bound GTPγS was quantified by filtration and liquid scintillation as described.6,78 Non-specific binding was determined in the presence of 100 mM unlabeled GTPγS. Specific binding was fit to a saturation binding isotherm (Y = Bmax + X / (KD + X)) using GraphPad PRISM 3.0.

