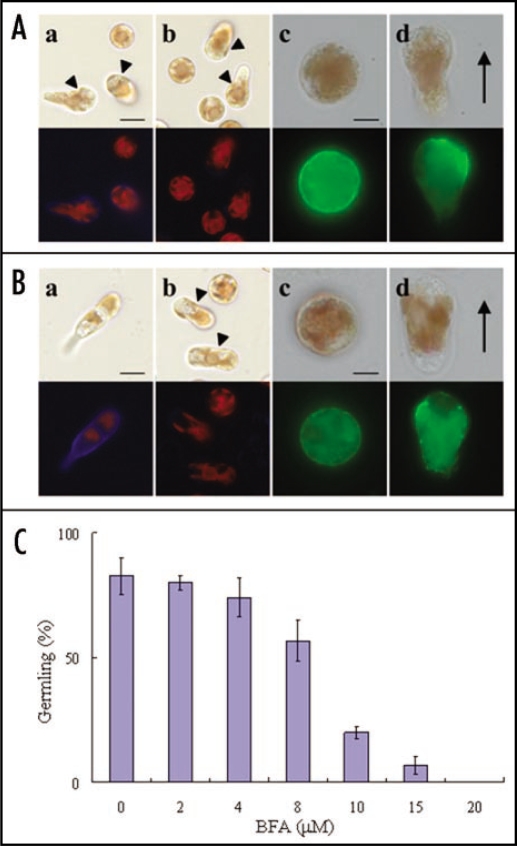
Figure 1.
Effect of BFA on the cell wall synthesis, F-actin localization and development of monospores. (A) Freshly released monospores were treated with (parts b–d) or without (part a) BFA (MP Biomedicals) at 20 µM for 3 h incubation. The cell wall (parts a and b) and F-actin (parts c and d) were stained with 0.01% Fluorescent Brightener 28 (Sigma) and 5 U· mL−1 Alex Flour 488 phalloidin (Molecular probe), respectively. Migrating monospores are indicated by arrowheads. (Part c) Cell with a round shape, (Part d) cell with a tapered shape during migration. Upper and lower photographs in each panel show bright field and fluorescent images, respectively. Direction of migrating monospores is indicated by an arrow. Scale bars: (Parts a and b) 10 µm; (Parts c and d) 5 µm. (B) Freshly released monospores were treated with (parts b–d) or without (part a) BFA at 20 µM for 24 h incubation. The cell wall (parts a and b) and F-actin (parts c and d) were stained with 0.01% Fluorescent Brightener 28 and 5 U· mL−1 Alex Flour 488 phalloidin, respectively. Migrating monospores are indicated by arrowheads. (Part c) Cell with a round shape, (Part d) cell with a tapered shape during migration. Upper and lower photographs in each panel show bright field and fluorescent images, respectively. Direction of migrating monospores is indicated by an arrow. Scale bars: (Parts a and b) 10 µm; (Parts c and d) 5 µm. (C) Dose-dependent effect of BFA on early development of monospores. Freshly released monospores were treated with an increasing concentration (2–20 µM) of BFA for 24 h, and the number of germlings was counted. Data are presented as mean ± SD (n = 3).

