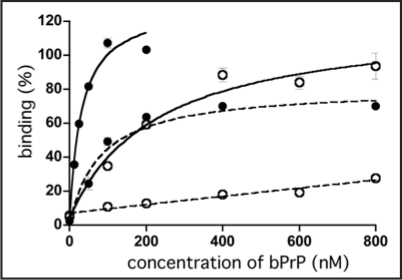
Figure 1.
Binding of apt #1 to bPrP and bPrP-β. Binding curves of apt #1 to bPrP and bPrP-β are shown by closed circles and open circles, respectively. Solid and dashed lines represent different buffer conditions: 10 mM K+ and 100 mM Na+, respectively. The binding data are analyzed by GraphPad PRISM (see Materials and Methods).

