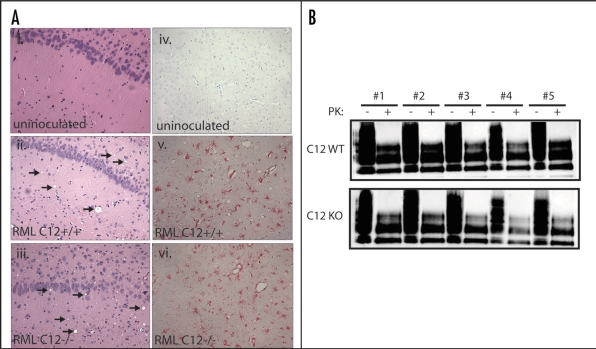
Figure 4.
Analysis of spongiform changes in C12 WT and KO brain sections (A, i and iii) show a similar amount of vacuolation, indicated by arrows, in the hippocampus of prion inoculated mice but no vacuolation in uninoculated mice [C12 WT is shown in (A, i)]. The amount of gliosis was examined by staining for GFAP, which did not show staining in uninoculated samples [C12 WT is shown in (A, iv)] but showed abundant staining in prion inoculated samples from C12 WT and C12 KO (v and vi). For all of these parameters, blinded analysis did not reveal any differences between prion inoculated C12 KO and control brains. (B) The amount of proteinase K resistant PrP was assayed in whole brain homogenates taken from prion inoculated C12 WT (n = 5) and C12 KO (n = 5) mice (treated for 50ug/ml PK for one hour at 37C), which all showed ample PK resistant PrP by immunoblotting with SAF83. Total PrP inputs are shown to ensure equivalent loading.

