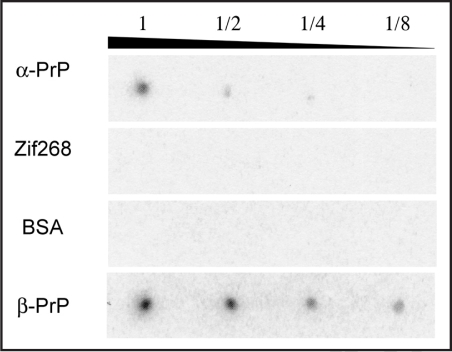
Figure 4.
Evaluation of the specificity of clone 4–9 by aptamer blotting. Images of chemiluminescence detection are shown. On the left, the immobilized proteins are indicated. The upper number shows the quantitative ratio of proteins immobilized on the membrane. “1” means 1 pmol proteins in the case of α-PrP, Zif268 and BSA, whereas “1” means 4 pmol proteins in the case of β-PrP.

