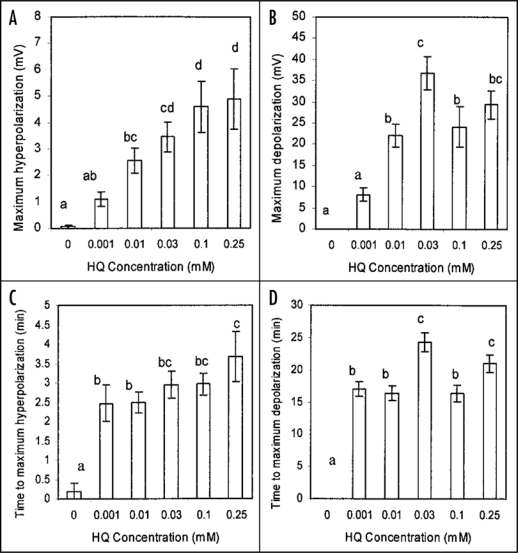
Figure 2.
The effect of hydroquinone treatment on the membrane potential of root cortex cells of the elongation/root hair zone of Phaseolus vulgaris plants. Shown in A is the mean maximum hyperpolarization induced following inclusion of hydroquinone in the perfusion stream bathing root tips while B shows the mean maximum magnitude of subsequent depolarization relative to the initial pretreatment membrane potential. C shows the mean time to maximum hyperpolarization from the estimated time of initial hydroquinone-root contact and D shows the mean time the maximum depolarization. Errors bars indicate s.e.; n = 10 or 11 for each concentration except n = 15 for 0 mM. Letters a − d indicate significant differences between means (P < 0.05). Mean initial (immediately pretreatment) membrane potentials (0 mM = −149.5 +/− 5.3 mV; 0.001 mM = −162.8 +/− 6.0 mV; 0.01 mM = −155.1 +/− 4.6 mV; 0.03 mM = −153.6 +/− 6.6 mV; 0.1 mM = −161.5 +/− 7.8 mV; 0.25 mM = −149.7 +/− 11.7 mV;) were not significantly different between treatments.

