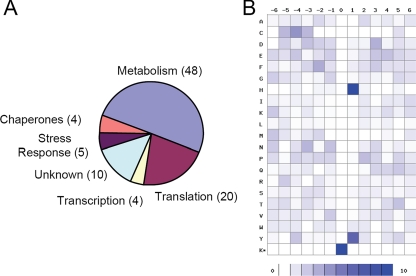
Fig. 2.
A, pie chart of functionally annotated protein groups that are lysine-acetylated. B, density map of lysine-acetylated peptides. The frequency of occurrence of amino acid residues surrounding sites of lysine acetylation was calculated, relative to the frequency of the residue within the entire E. coli genome, and schematically represented by a density map using a method described previously (11). Prevalence of specific amino acids at positions surrounding lysine acetylation sites is shown.

