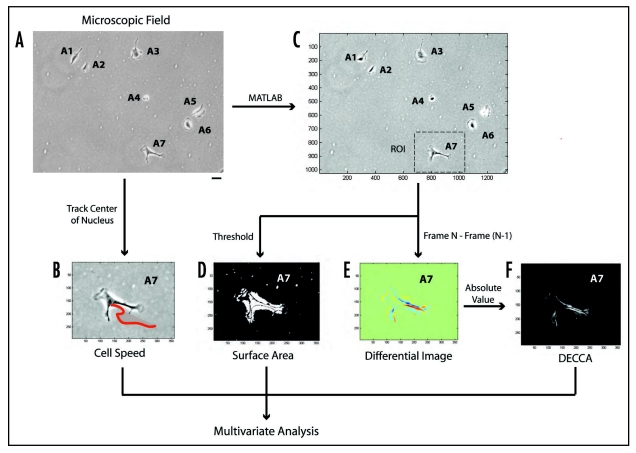
Figure 1.
Overview of Multivariate Profiling of Single Cells. This flowchart represents the step-wise progression of our image analysis technique, including: (A) phase-contrast image capture (six random fields per well, in duplicate) and manual application of unique identifying numbers to all cells (i.e., A1–A7); (B) tracking the center of each cell nucleus manually using Metamorph software to quantify cell speed; the applied red line represents cell tracks over the course of a movie. (C) selection of regions of interest (ROI) manually from original phase contrast images using MATLAB; (D) creating computer-generated thresholded images in MATLAB to calculate cell surface area, and (E) creating computer-generated differential images in MATLAB by subtracting the pixel intensities from one frame to the next. (F) Differential images were further processed by taking the absolute value of the pixel intensities to obtain the DECCA measurement. The scale bar seen in part (A) is equal to 100 µm. Image axes in (B–F) are MATLAB generated coordinates for each image and ROI.

