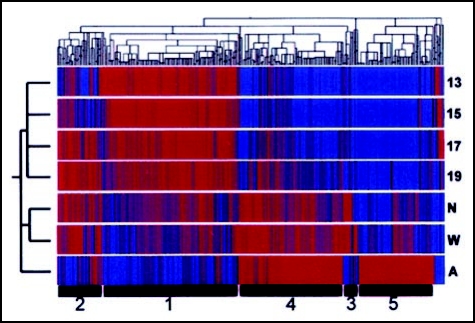
Figure 9.
Clustergram [made using the hierarchical clustering algorithm, GENESPRING (Silicon Genetics)] showing the grouping of 873 genes whose expression changed significantly at some point in rat kidney development using Affymetrix cDNA microarray genechips. Genes were identified using RNA isolated from a time series of kidney development [i.e., ed13, ed15, ed17, ed19, newborn (N), 1 week postpartum (W) and adult (A) kidneys] and clustered in two dimensions according to their gene expression and experimental vectors in Euclidian space after compressing the equalized data to a target maximum value of 3. K-means clustering revealed 5 distinct groups of gene expression patterns within the clustergram (numbers at the bottom) depending on their time-frame of expression. (From ref. 35).

