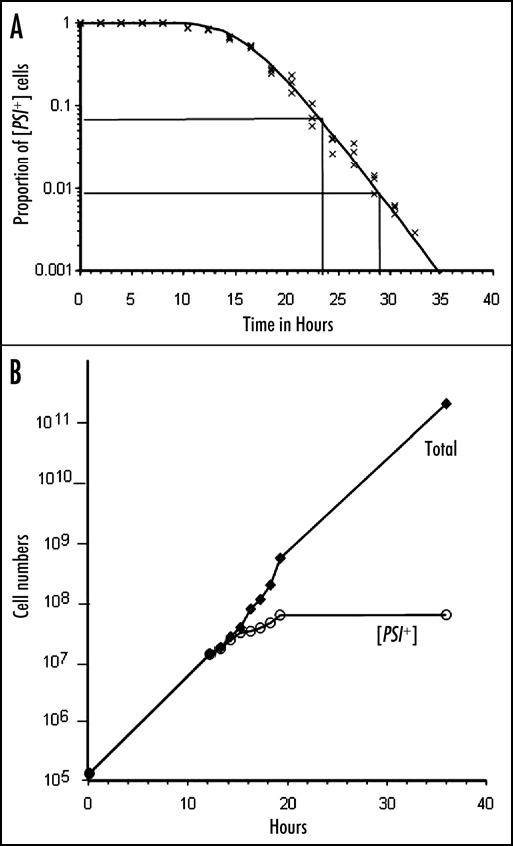
Figure 1.

(A) The proportion of γ+ cells left in a growing population following the addition of 5 mM guanidine hydrochloride. The slope of the exponential part of the fitted curve involves a halving of the proportion every 1.8 hours. This was derived from the doubling time of the cell numbers in this culture. The fitted line is from the model described by Cole et al. 43 (B) Data from a curing experiment as described in (A) replotted to show that the numbers of γ+ cells in the culture reaches a maximum but then stays constant as the culture continues to grow at the normal rate (compare ref. 44).
