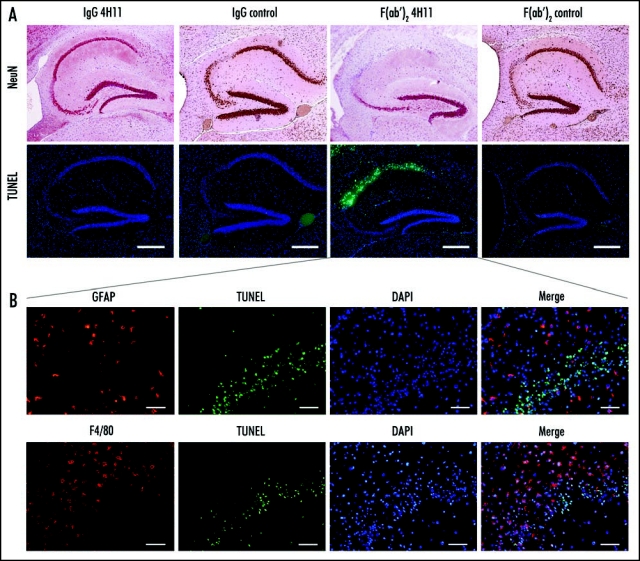
Figure 4.

Effect of the antibody treatment on neurons and glial cells in infected animals at the end of the treatment. (A) Neuron specific NeuN labeling highlighting the neuronal loss in the regions CA1 and CA2 of the hippocampus of the animals treated with 4H11 F(ab′)2 fragments, while the animals from all the other groups did not show neuronal loss (row 1). TUNEL labeling showing apoptotic neurons in the same region of the hippocampus of the animals treated with 4H11 F(ab′)2 fragments (row 2). Bar = 500 µm. (B) Higher magnification and labeling for gliosis of the hippocaampus of the 4H11 F(ab′)2 treated mouse shown in (A) (lines show the corresponding panel A). Immunofluorescence analysis revealed the presence of GFAP positive reactive astrocytes (row 1, red labeling) and F4/80 positive microglial cells (row 2, red labeling) in the vicinity of the apoptotic neurons labelled by TUNEL (2nd and 4th columns, green) in the hippocampus of 4H11 F(ab′)2 fragments treated animals. Bar = 50 µm.
