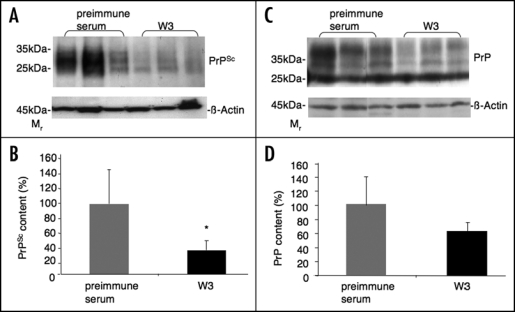
Figure 2.

Analysis of total PrP and PrPSc levels in the spleen of scrapie infected mice treated with polyclonal anti-LRP antibody W3 and preimmune serum 90 days post infection. LRP/LR antibody W3 and preimmune serum was intraperitoneally injected into C57BL/6 mice for 12 weeks. C57BL/6 mice were intraperitoneally inoculated with RML prions (10%) one week after the first antibody/preimmune serum injection. (A) Spleen of C57BL/6 mice were collected 90 days post infection and analyzed for the PrPSc content after Proteinase K digestion by Western blotting using anti-PrP antibody SAF 83. Western blot analysis of the PrPSc levels in the spleen of three W3 and three preimmune serum treated mice are shown. β-actin was used as a loading control (detection by an anti-β-actin antibody). (B) Densitometric measurements of Western blots from six spleens per group revealed a significant reduction of the PrPSc level by 66% in the W3 treated group compared to the preimmune serum treated group, for which the PrPSc level was set to 100% (*p < 0.05). Quantification of PrPSc signals were normalized by β-actin levels. Quantification of the western blot signals was carried out by densitometric measurements using the Image J software (mean + SD). (C) Spleen samples of C57BL/6 mice (collected 90 days post infection) were analyzed for quantification of the total PrP content by western analysis using anti-PrP antibody SAF 32. Western blot analysis of the PrP levels (in the absence of Proteinase K) in the spleen of three W3 and three preimmune serum treated mice is shown. β-actin was used as a loading control (detection by an anti-β-actin antibody). (D) Densitometric measurements of western blots from six spleens per group revealed a reduction of total PrP content by 39% in the W3 treated group compared to the preimmune serum treated group, for which the total PrP level was set to 100% (p < 0.2). Quantification of total PrP signals were normalized by β-actin levels. Quantification of the western blot signals was carried out by densitometric measurements using the Image J software (mean + SD).
