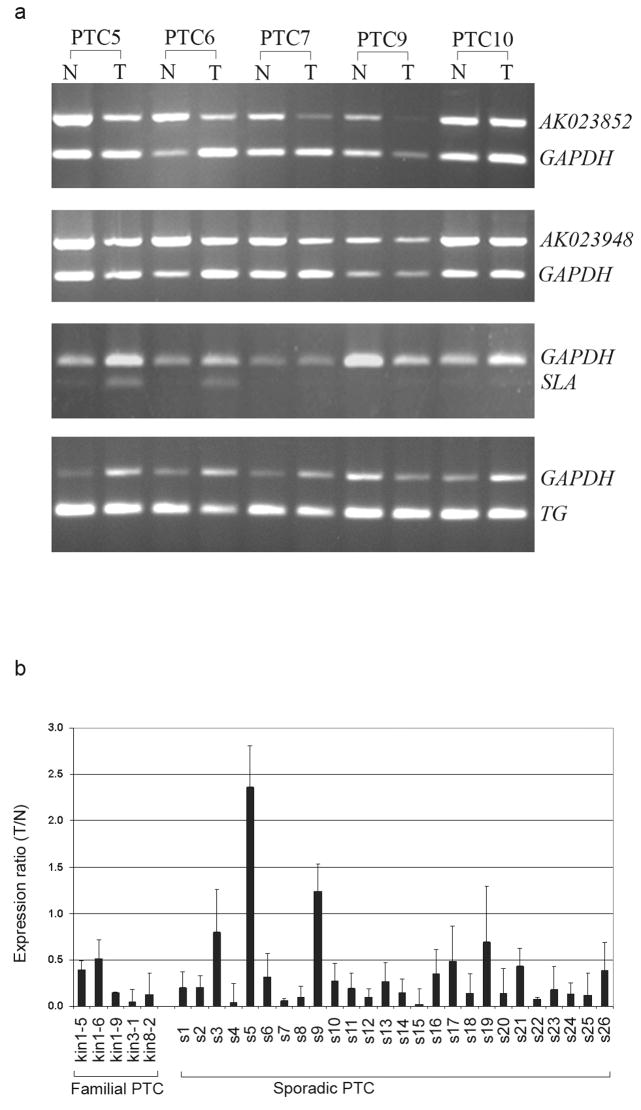
Figure 4.
Gene expression analysis in PTC. (a) Semi-quantitative RT-PCR of AK023852, AK023948, SLA, and TG in 5 sporadic PTC samples from which tumor (T) and paired unaffected thyroid tissue (N) were analyzed. GAPDH was used as an internal control. (b) Quantitative real time RT-PCR of AK023948 in familial and sporadic PTC samples. GAPDH was used as control. The expression ratio (T/N) of PTC tumor (T) versus paired unaffected normal (N) was calculated by the comparative threshold cycle method (mean and the standard deviation are shown).

