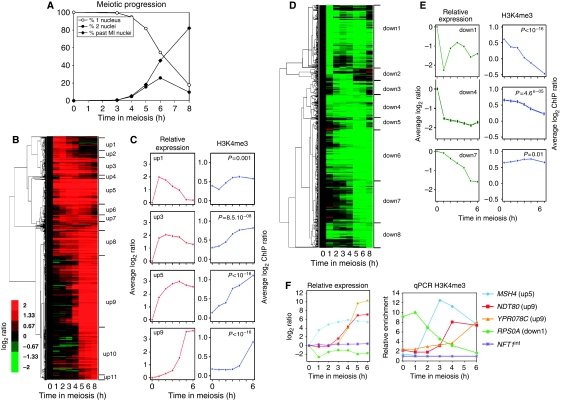
Figure 3.
Links between meiotic transcriptional gene regulation and histone H3K4 trimethylation. (A) Meiotic progression of the wild-type strain (ORD8622) used for the transcriptome analysis. The values presented are the average of the three independent time courses used to generate the transcriptome data. (B) Hierarchical clustering of the 1074 meiotically upregulated genes. Genes are grouped according to their induction pattern. The name of the clusters up1–up11 is indicated. The colour code reflects the quantitative change of expression relative to time 0 h. (C) Left panels: average expression change relative to time 0 h along meiosis for a subset of upregulated clusters. Right panels: on the 0–500 bp region of each gene of the same clusters, the average level of H3K4 trimethylation was estimated after ChIP and microarray hybridization and represented as a function of time during meiosis. (D) Hierarchical clustering of the 723 downregulated genes. Eight clusters down1–down8 are defined. Other legends as in (B). (E) Average expression changes along meiosis for a subset of downregulated genes clusters. Other legends as in (C). (F) Meiotic variations of H3K4me3 in selected meiotically induced or repressed genes. The relative expression profile obtained from the transcriptome analysis is shown for each gene for comparison (left). Quantitative measurement of H3K4me3 by qPCR (right). Enrichment values were normalized to the enrichment value of NFT1int, an internal sequence of the large NFT1 gene, used for background H3K4me3 control.

