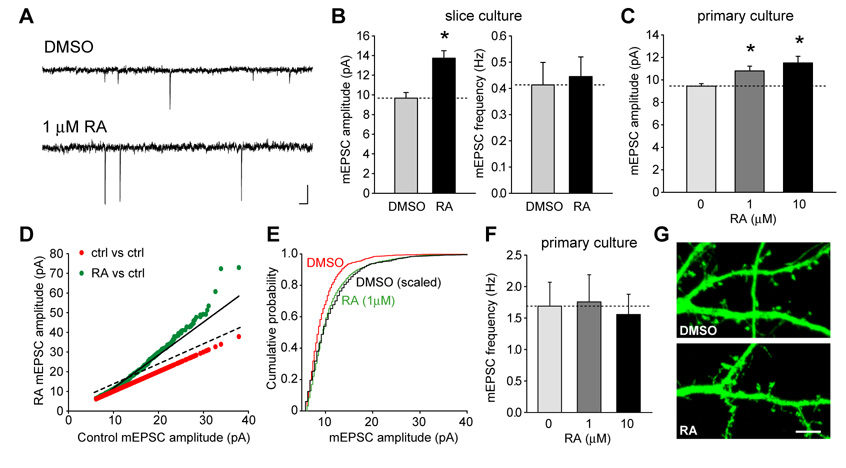
Figure 1. RA induces synaptic scaling.
(A) Representative mEPSC traces from control (DMSO) and RA-treated neurons in dissociated cultures. Scale bar: 20 pA, 20 ms. (B) Acute RA (1 µM) treatment in cultured hippocampal slices significantly increased the amplitude but not frequency of mEPSCs in the pyramidal neurons (DMSO, n = 11; RA, n = 16; *, p < 0.0005). (C) RA treatment increased mEPSC amplitudes in dissociated neuronal cultures (n = 11 for each group; *, p < 0.01). (D) and (E) RA scaled up mEPSC amplitudes multiplicatively. (D) Ranked RA amplitudes were plotted against ranked control amplitudes (green dots), and the data is best described by a multiplicative (solid line), not an additive (dashed line), increase in mEPSC amplitudes. Red dots are control plotted against control, and have a slope of 1. Best fit: RA = control × 1.68 – 5.14, R = 0.989, p < 0.0001. (E) The cumulative distribution of mEPSC amplitudes from DMSO- (red) and RA (green)-treated neurons (n = 11 for each group). Scaling up the DMSO distribution by a factor of 1.68 produced a good fit to the RA-treated distribution (black line). (F) The average mEPSC frequency is not changed by RA treatment (n = 11 for each group, p > 0.9). (G) Acute RA treatment did not induce new spine formation. GFP-transfected neurons were treated with DMSO or 1 µM RA for one hour and fixed. No obvious morphological changes induced by RA were observed. Scale bar: 5 µm.

