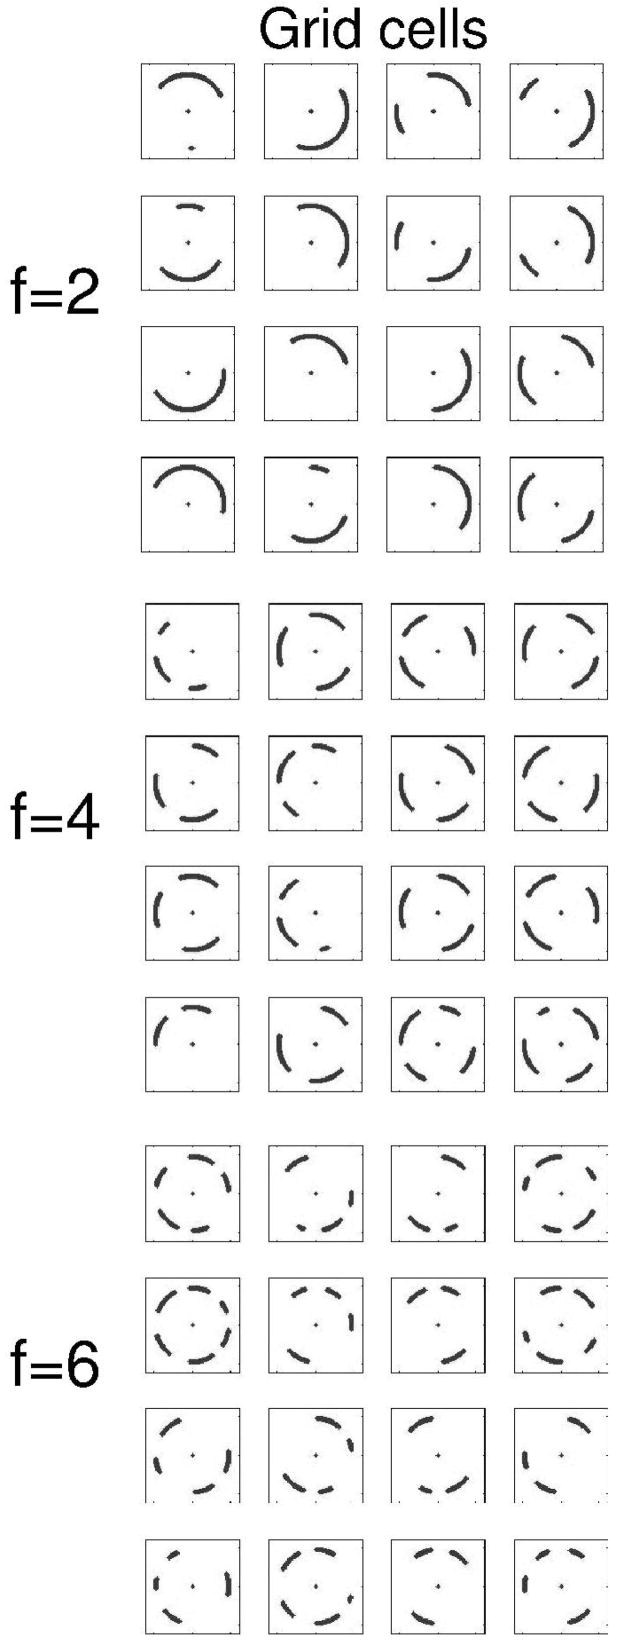
Figure 3.
Example of activity in the population of grid cells during running on the circular track. Each square shows the pattern of firing of one simulated grid cell during running on the circular track. Firing fields are made up of gray dots indicating location when grid cell fires. Grid cells differ by baseline frequency f=2,4,6 in groups. Within groups, grid cells differ by initial phase, with phase φ=0, π/2, π and 3π/2. As in Fig. 2, orientation ϕ=0

