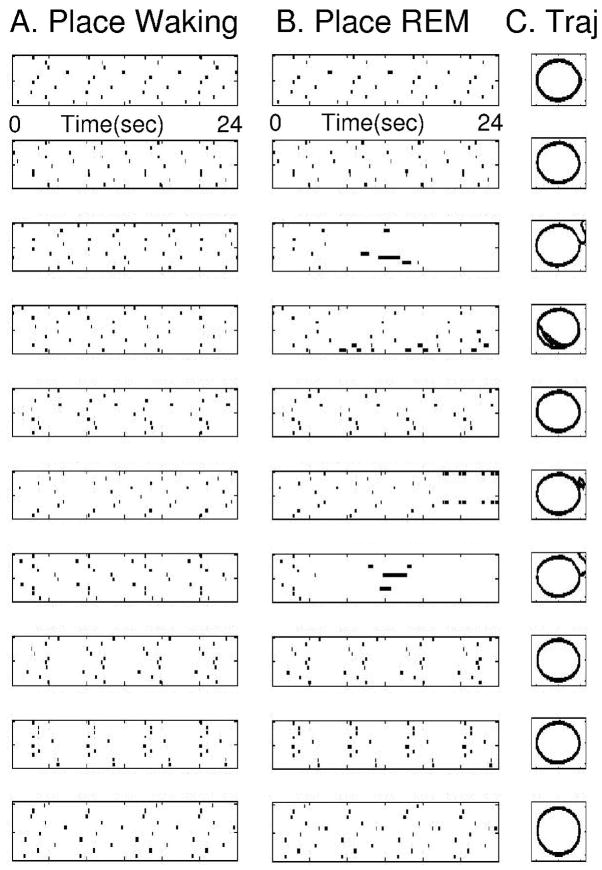
Figure 8.
Examples of place cell activity and retrieved trajectory during ten different simulations of the full model. Each row shows a separate simulation. Six out of ten simulations showed full replay during REM. Column A plots show spiking activity of 10 place cells during waking. Column B plots in the same row show spiking activity of the same 10 place cells during REM replay. Note similarity of patterns in Column B to Column A. Column C plots the inverse transform of grid cell activity during REM, showing successful retrieval of the circle in 6 out of 10 cases (track diameter 95 cm). In unsuccessful cases, the trajectory diverges from the circular track.

