
Figure 1.
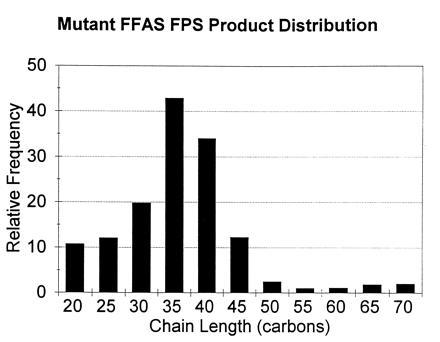
Mutant F112A/F113S FPS product distribution shows relative frequency of production, on a molar basis, of different chain length isoprenes. Each observed cpm for [14C]IPP incorporated into the product was normalized by dividing by the number of IPPs incorporated into the product, and then by the lowest value of the series, giving a value of one for the lowest value of the distribution.