
Fig. 6.
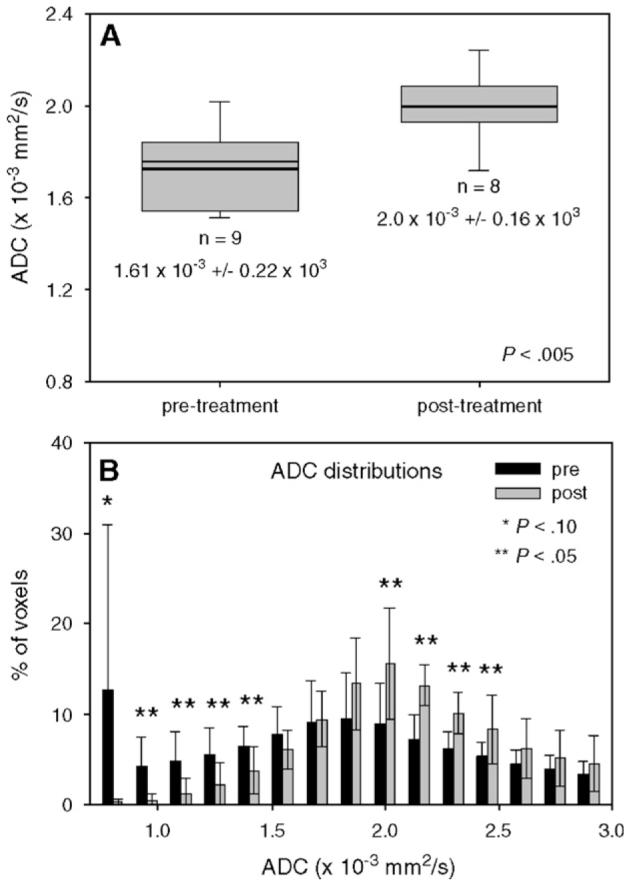
Changes in ADC measurements pretreatment and post-treatment. (A) The bold line in each vertical bar plot indicates the mean value, while the other lines indicate the 5%, 50%, 75% and 95% percentiles, respectively. (B) The ADC parameter distribution displays many bins showing significant changes from pretreatment to post-treatment results. There is a significant increase in ADC values post-treatment.