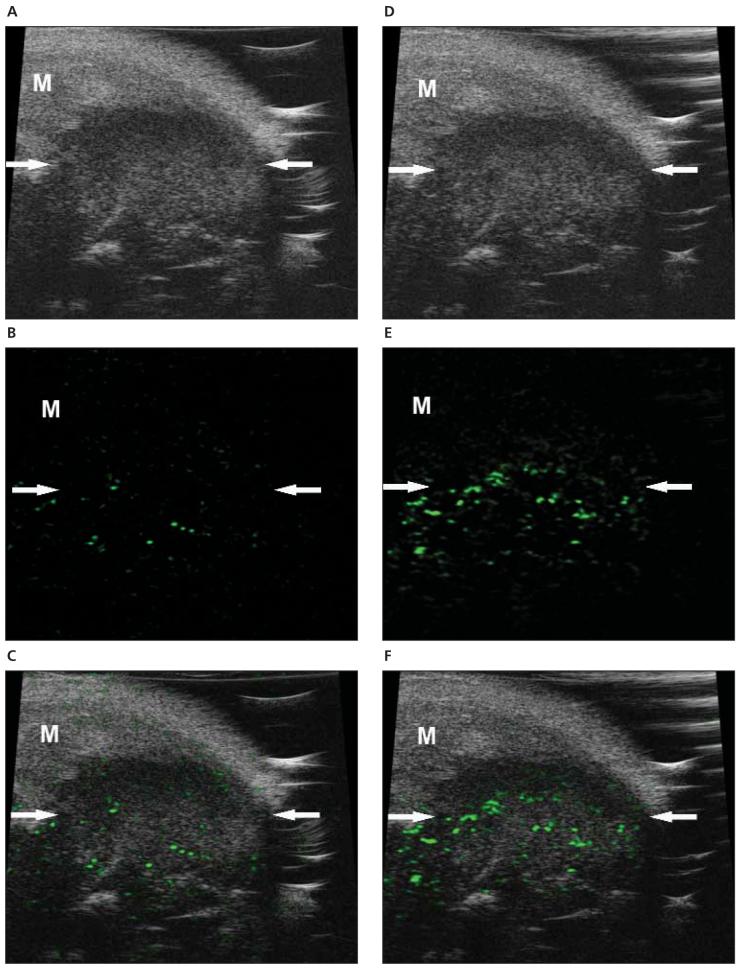
Figure 3.
Molecular sonograms of a 4T1 tumor. A—C, Control UCA enhanced B-mode sonogram (A), color-coded background-subtracted image (B), and background-subtracted image imposed over a predestruction B-mode image (C). D—F, Vascular endothelial growth factor receptor 2—targeted UCA enhanced B-mode sonogram (D), color-coded background-subtracted image (E), and background-subtracted image imposed over a predestruction B-mode image (F). These images show a significant difference between retention of the control and VEGFR2-targeted UCAs in a small subcutaneous tumor (arrows). A difference in UCA retention between the tumor and surrounding muscle (M) was also noted.

