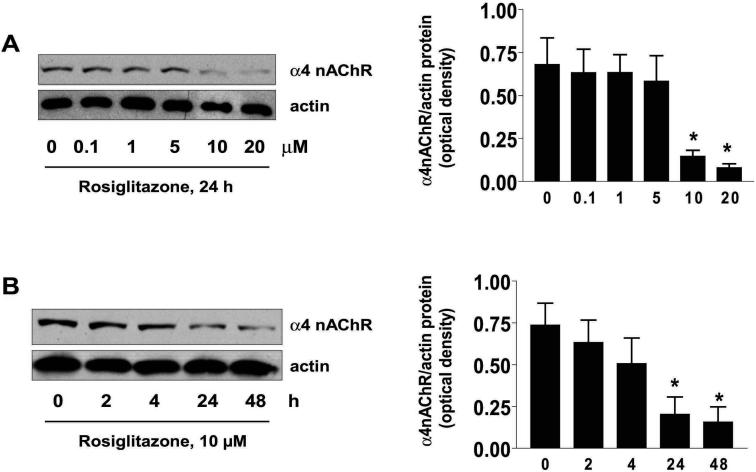
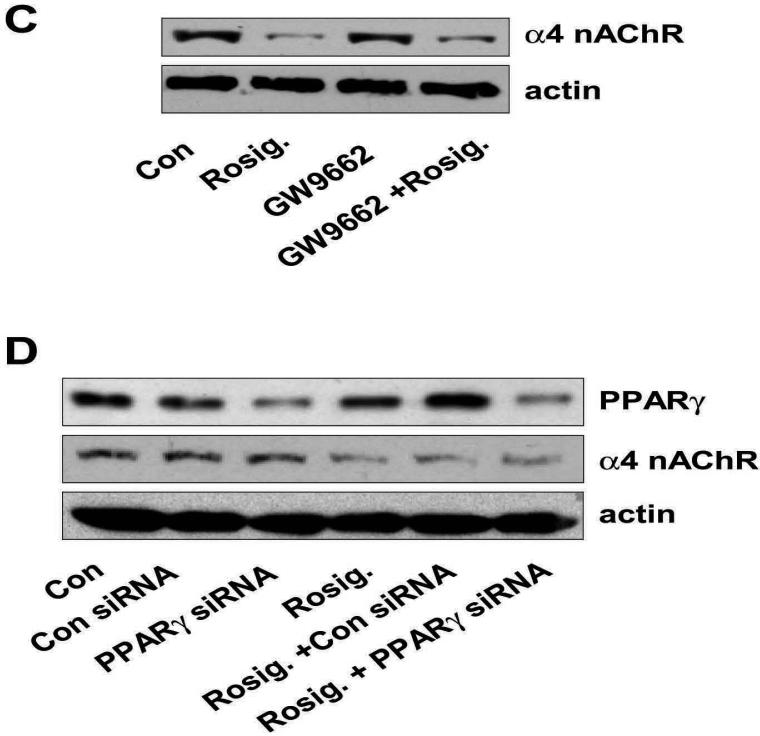
Figure 2. Rosiglitazone inhibits expression of α4 nAChR in a PPARγ-independent pathway.
A, Cellular protein (20 μg) was isolated from H1838 cells treated with increasing concentrations of rosiglitazone for 24 h followed by Western blot analysis for α4 nAChR protein using an anti-α4 nAChR antibody. Blots were also incubated with an anti-actin antibody to control for gel loading. The bar graph to the right panel represents the mean ± SD of α4 nAChR/actin of at least three independent experiments. B, Cellular protein (20 μg) was isolated from H1838 cell lines cultured with rosiglitazone (10 μM) in the indicated time period. Afterward, western blot analysis was performed to α4 nAChR protein using anti-α4 nAChR antibody. The bar graph to the right panel represents the mean ± SD of α4 nAChR/actin of at least three independent experiments. The actin was used as internal control for normalization purpose. C. Cellular protein was isolated from H1838 cells cultured for 2 h in the presence or absence of GW9662 (20 μM) before exposure of cells to rosiglitazone (Rosig., 10 μM) for an additional 24 h, followed by Western blot analysis for α4 nAChR protein. Con, indicates untreated control cells. D, Cellular protein (20 μg) was isolated from H1838 cells, which were transfected with control or PPARγ siRNA (100 nM each) for 40 h before exposure of cells to rosiglitazone for an additional 24 h. afterward, Western Blot analysis were performed to determine the PPARγ and α4 nAChR protein. Blots were also incubated with an anti-actin antibody for normalization purposes. Con, indicates untreated control cells.


