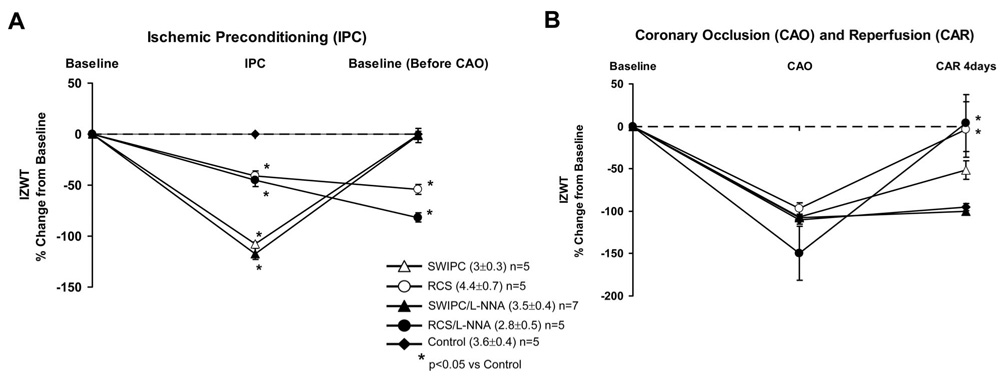
Figure 1.
A, Changes in IZWT during IPC and recovery from IPC (ie, baseline before lethal CAO) in control (sham), SWIPC, RCS, SWIPC/L-NNA, and RCS/L-NNA pigs. Absolute values for IZWT are shown in parentheses, and the number of pigs in each group is noted. Note that SWIPC resulted in a complete loss of function but returned to baseline after IPC, whereas RCS only partially reduced IZWT, but function remained depressed after RCS was completed. B, Changes in IZWT during the lethal 60-minute period of CAO followed by 4 days of reperfusion in all 5 groups. Note that 60 minutes of CAO resulted in a similar reduction in IZWT in all groups, but recovery was different. The greatest recovery of IZWT occurred in the RCS groups, consistent with reduced infarct size data shown in Figure 2.

