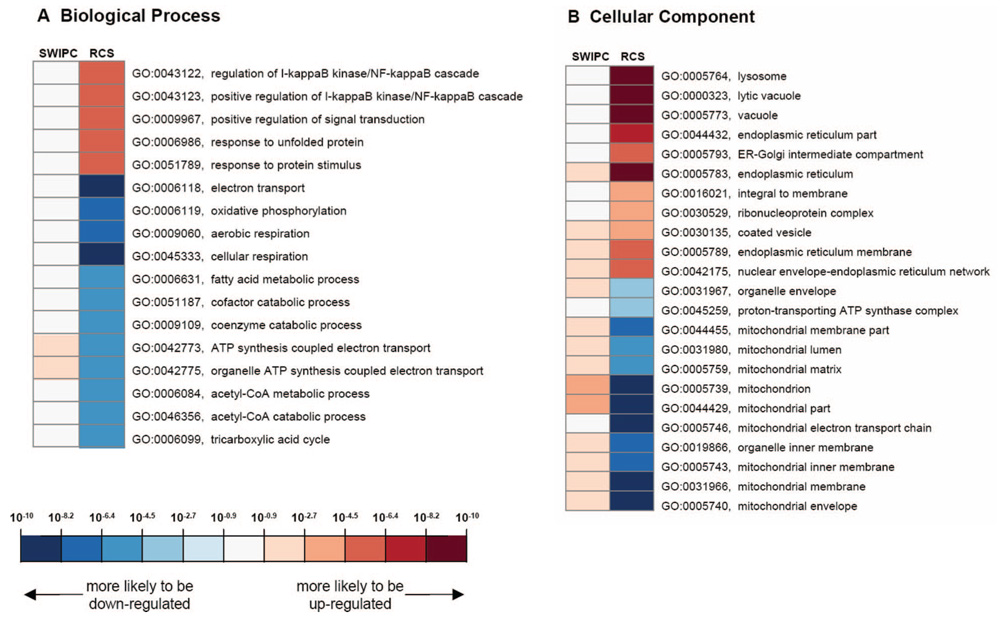
Figure 5.
Significant GO entries were selected by the hypergeometric test (<0.05 after Bonferroni correction) for SWIPC and RCS models and are shown in a heat map with color representing the significance score (see Methods for its calculation). As shown in the color scale at the bottom, GO entries with positive significance scores (greater significant probability values for biased representation of upregulated genes) are shown in red, and those with negative scores (greater significant probability values for biased representation of downregulated genes) are shown in blue. To avoid redundancy in the graph, GO entries with >100 child entries are not shown. NF indicates nuclear factor; CoA, coenzyme A.

