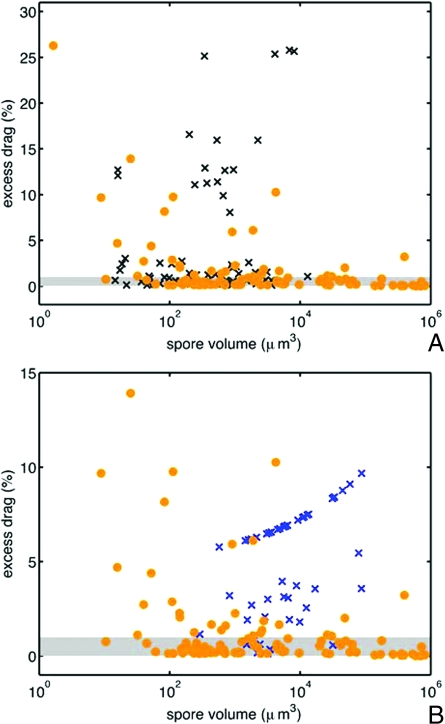
Fig. 5.
Ejected and nonejected spores. (A) Comparison of excess drag—the difference in drag between the real spore shape and the optimal shape of the same size—on logarithmic axes for forcibly ejected spores (·) and (×) insect-dispersed Sordariomycete spores. (B) Comparison of excess drag for forcibly ejected spores and hypogeous Pezizomycete spores (×). Species within the shaded region have drag-to-mass ratios within 1% of the optimal value. More than 75% of forcibly ejected spores, but <45% of insect dispersed spores and 16% of hypogeous spores have excess drag values below this bound. The axes have been rescaled in B, removing the ejected species G. platystroma from the plot window.

