
Figure 5.
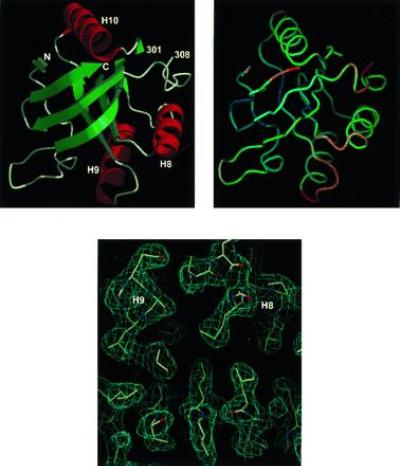
The three-dimensional structure of sht-GroEL191-345. Secondary structure representation is drawn with molscript (37) and raster3d (38). Helices are labeled as in Braig et al. (3). N and C refer to the N terminus (residue 191) and C terminus (residue 336) of the model, respectively. The backbone representation (Upper Right) is in the same orientation as Upper Left, color-coded according to B factor of main-chain atoms: blue (20 Å2) to red (60 Å2), drawn with program o (27). (Lower) Representative region of electron density, calculated using refined coordinates, viewed along the helices H8 and H9.